Between 2016 and 2019, 13 representative farms were developed for the CucCAP project. Representative farms are virtual farms that represent the production practices of a specific crop and region. The representative farms were developed in California (6 farms), Florida (3 farms), Pennsylvania (1 farm), North Carolina (1 farm) and Texas (2 farms). Moreover, the crops covered include cantaloupes, cucumbers, pickles and watermelons. In California and Florida, three different representative farms sizes were developed for the same crop to measure economies of scale.
Data collected for each farm includes prices, yields and costs of production. Prices and yields for the last 10 years were collected to incorporate their volatility in the analysis of net returns per acre. Therefore, the results are given as probabilities of success or being above or below a target economic value rather than deterministic numbers. These probabilistic results can be shown in stoplight charts of net returns per acre. The red portion of the chart shows the probability of the net return of a specific representative farm below zero (i.e. negative returns). The yellow portion of the chart is the probability of being between $0 and $1000 per acre. Finally, the green portion is the probability of being above $1000.
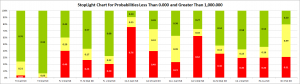
Figure 1. Stoplight Charts for 13 Representative Farms, Baseline.
Baseline results for all 13 representative farms are shown in Figure 1. The baseline results are the status quo of these farms. To illustrate, the first farm, TX Cant NR, is a cantaloupe farm in Texas that has three percent probability of having negative net returns, 21 percent chance of having net returns between zero and $1,000 and 76 percent chance of having net returns above $1,000 per acre. Moreover, the third, fourth and fifth bars in Table 1 represent a small, medium and large watermelon farms in Florida, FL S Wat NR, FL M Wat NR and FL L Wat NR, respectively. Clearly there are economies of scale in Florida watermelon production given that as the farms gets larger the probability of negative net returns, red portion of the bars, are reduced from 40 percent on the small farm to 20 percent for the large farm. The same happens form California watermelon and cantaloupe farms.
The baseline results are very useful to understand the status quo of the industry. At the same time allow us to do “what if” analysis and see how each representative farm is affected by the change or shock. Figures 2, 3 and 4 summarize the net returns for each representative farm given a 20 percent increase in yield, a 20 percent increase in price and a 20 percent increase in both yield and price, respectively. As expected positive increases in yields and prices reduces the probabilities of negative net returns, red portion of the bars, but at the same time it helps small and medium farms reduce the red portions of the bars at a higher rate that the large farms. For example, a 20 percent yield increase would reduce the probability of negative net returns for Florida small and medium watermelon farms from 40 to 20 percent and from 26 to 10 percent, respectively, while for large farms went from 20 to 7 percent.
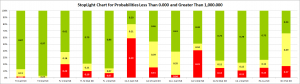
Figure 2. Stoplight Charts for 13 Representative Farms, 20 Percent Yield Increase.
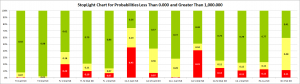
Figure 3. Stoplight Charts for 13 Representative Farms, 20 Percent Price Increase.
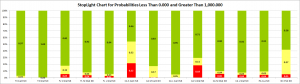
Figure 4. Stoplight Charts for 13 Representative Farms, 20 Percent Yield and Price Increase.
